Chart Craft
Technical Analysis Basics
Candles, structure, levels and indicators — the reading skills that come before any indicator settings debate.
Financial Markets Research Team9 min read
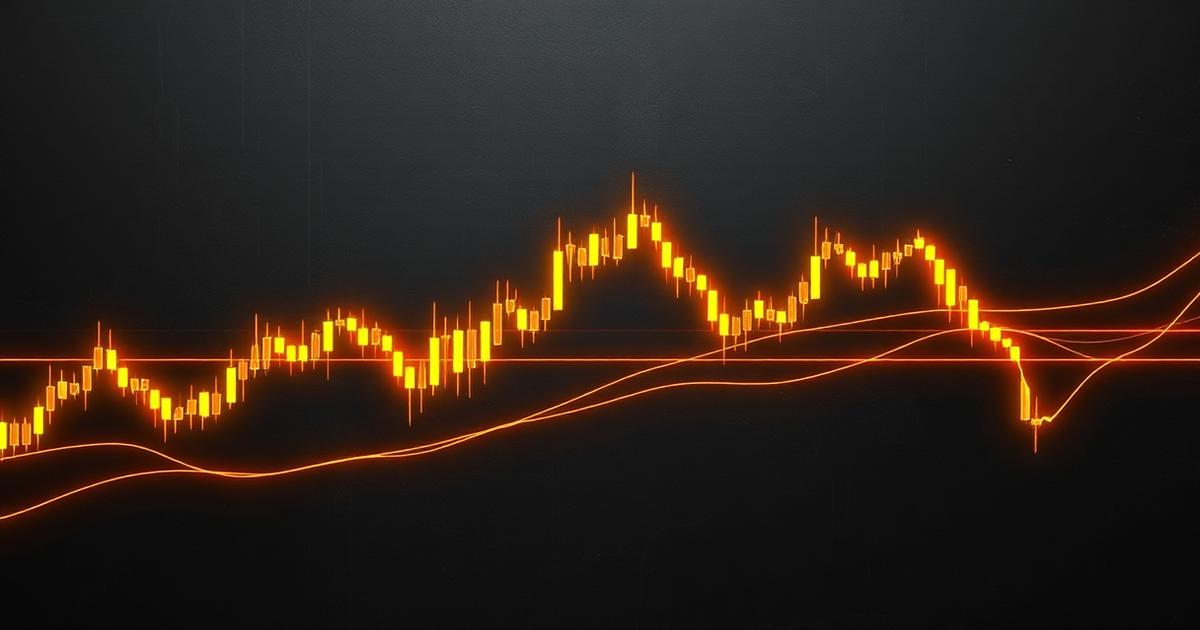
Every chart is a record of transactions. A candlestick summarises four facts about a period: where trading opened, how high and low it reached, and where it closed. The relationship between those four numbers, repeated across many periods, is what analysts read. Long upper wicks indicate that higher prices were rejected; a narrow body after a wide one suggests hesitation. None of these observations predict anything on their own — they describe the balance between buyers and sellers at a moment in time.
Structure before indicators
The most durable concept in charting is market structure: the sequence of highs and lows. A series of higher highs and higher lows defines an uptrend; the reverse defines a downtrend; overlapping swings define a range. Because structure derives directly from price rather than from a formula, it does not lag and it does not need parameters. Most experienced readers establish structure first and only then consider whether an indicator adds anything.
Support, resistance and why levels matter
Levels are simply prices where the market has previously changed behaviour. They matter because participants remember them and place orders around them, which makes reaction more likely — not certain. A level is best treated as a zone rather than a line, and its significance grows with the number of times it has produced a reaction and with the timeframe on which it appears.
Indicators: what they actually do
- Moving averages smooth price to make direction easier to see. They lag by construction; the longer the period, the greater the lag and the fewer the false signals.
- Oscillators such as RSI compare recent gains to recent losses, producing a bounded reading. They describe momentum, not value, and can remain at an extreme throughout a strong trend.
- Volatility bands place a channel around an average using a statistical measure of dispersion, highlighting when movement is unusually wide or narrow.
- Volume measures indicate participation. Moves accompanied by unusually high participation are generally treated as more informative than quiet drifts.
Timeframes and the alignment problem
A market can be trending upward on a weekly chart and falling on an hourly one. Neither reading is wrong; they answer different questions. Most structured approaches define a higher timeframe for context and a lower one for timing, and they refuse trades where the two disagree. Without that rule, a trader can find justification for any position at any time, which is precisely the problem analysis is meant to solve.
Testing what you see
The honest test of a pattern is whether it still appears useful when applied mechanically across a large sample, including periods you did not choose. Manual review invites hindsight: patterns are obvious after the fact and ambiguous in real time. Recording a rule in advance and applying it without discretion is slower, less satisfying, and far more informative.
The limits worth stating plainly
Technical analysis cannot tell you what will happen. It can help you define where an idea is wrong, which is far more actionable. Its practical value lies in producing repeatable, testable decision points and clear invalidation levels — the inputs that risk management needs. Used that way, it complements the sizing rules in Risk Management in Trading. Used as prophecy, it becomes an expensive form of pattern-matching.
Start with a single instrument and a single timeframe. Describe what happened yesterday in structural terms before attempting to say anything about tomorrow. That discipline builds the reading ability that no indicator preset can substitute for.
Platform research
Comparing trading environments? Read our detailed analysis of ProMarketsCFD for the criteria we use when assessing a platform.
Educational disclaimer: this article is published for informational and educational purposes only. It is not financial, investment or trading advice, and it does not recommend any platform or instrument. Trading involves substantial risk, including the possible loss of the funds committed.
Financial Markets Research Team
Our editorial team researches market structure, trading mechanics and platform documentation, then translates it into plain-language educational material. We publish independently, do not sell trading services, and do not provide personalised financial advice.